Authors: Lewis A. Jones & William Gearty
Last updated: 2026-07-08
Introduction
rphylopic is a package that allows users to easily fetch and visualize silhouettes of organisms from PhyloPic. The package allows users to add silhouettes as layers or as data points to both base R and ggplot2 plots. Additional functionality allows users to pick between available silhouettes, transform them (e.g., rotate and recolor), and save image files. This vignette will give you an overview of the package and provide example usage.
Installation
The rphylopic package can be installed via CRAN or its dedicated GitHub repository if the development version is preferred. To install via CRAN, simply use:
install.packages("rphylopic")To install the development version, first install the
remotes package, and then use
install_github() to install rphylopic
directly from GitHub.
install.packages("remotes")
remotes::install_github("palaeoverse/rphylopic")
You can now load rphylopic using the default
library() function:
Before we get onto the good stuff, the development team has a small request. If you use rphylopic in your research, please cite the associated publication. This will help us to continue our work in supporting you to do yours. You can access the appropriate citation via:
citation("rphylopic")## To cite rphylopic in publications, use the following citation:
##
## Gearty, W. and Jones, L.A. 2023. rphylopic: An R package for fetching, transforming, and
## visualising PhyloPic silhouettes. Methods in Ecology and Evolution, 14(11), 2700-2708. doi:
## 10.1111/2041-210X.14221.
##
## A BibTeX entry for LaTeX users is
##
## @Article{,
## title = {rphylopic: An R package for fetching, transforming, and visualising PhyloPic silhouettes},
## author = {William Gearty and Lewis A. Jones},
## year = {2023},
## volume = {14},
## number = {11},
## pages = {2700-2708},
## journal = {Methods in Ecology and Evolution},
## doi = {10.1111/2041-210X.14221},
## }Also, don’t forget to acknowledge the contributors of the silhouettes that you use (see Get attribution).
How does it work?
Every silhouette available via PhyloPic has a universally unique
identifier (UUID). The first step to get a PhyloPic silhouette into R is
to get a UUID. To do so via rphylopic you can use the
get_uuid() function to search PhyloPic based on a taxonomic or
phylogenetic name (e.g., Canis lupus or pan-Mollusca) and
return the first matched UUID. Using the returned UUID, you can then
fetch the respective silhouette using get_phylopic().
However, multiple silhouettes (and hence UUIDs) can exist for a searched
name. The n argument in get_uuid() allows you
to fetch n matched UUIDs.
Get an image uuid
# Load rphylopic
library(rphylopic)
# Get a single image UUID for a species
uuid <- get_uuid(name = "Canis lupus")
# Get the image for that UUID
img <- get_phylopic(uuid = uuid)
# But multiple silhouettes can exist per species...
uuid <- get_uuid(name = "Canis lupus", n = 5)
Pick an image
As multiple silhouettes can exist for a searched name, it can be
difficult to pick the correct UUID, especially without visualizing the
images. The pick_phylopic() function plots all requested
silhouettes and provides an interactive menu to allow you to select the
right image for you. Let’s go with option 1!
# How do I pick?!
# It's difficult without seeing the image itself, let's use:
img <- pick_phylopic(name = "Canis lupus", n = 4, view = 4)
Plot an image
Now we have selected our silhouette, we can make some plots!
Base R
Let’s start with base R by using
add_phylopic_base():
# OK, now we've got the image we want... let's add it to a plot!
plot(x = 1, y = 1, type = "n", ann = FALSE)
add_phylopic_base(img = img, x = 1.25, y = 1.25, height = 0.25)

# But can't we just add an image straight away using the UUID? Sure!
uuid <- get_uuid(name = "Canis lupus", n = 1)
add_phylopic_base(uuid = uuid, x = 1, y = 1, height = 0.25)

# What about just using the first image linked to the name? Definitely!
add_phylopic_base(name = "Canis lupus", x = 0.75, y = 0.75, height = 0.25)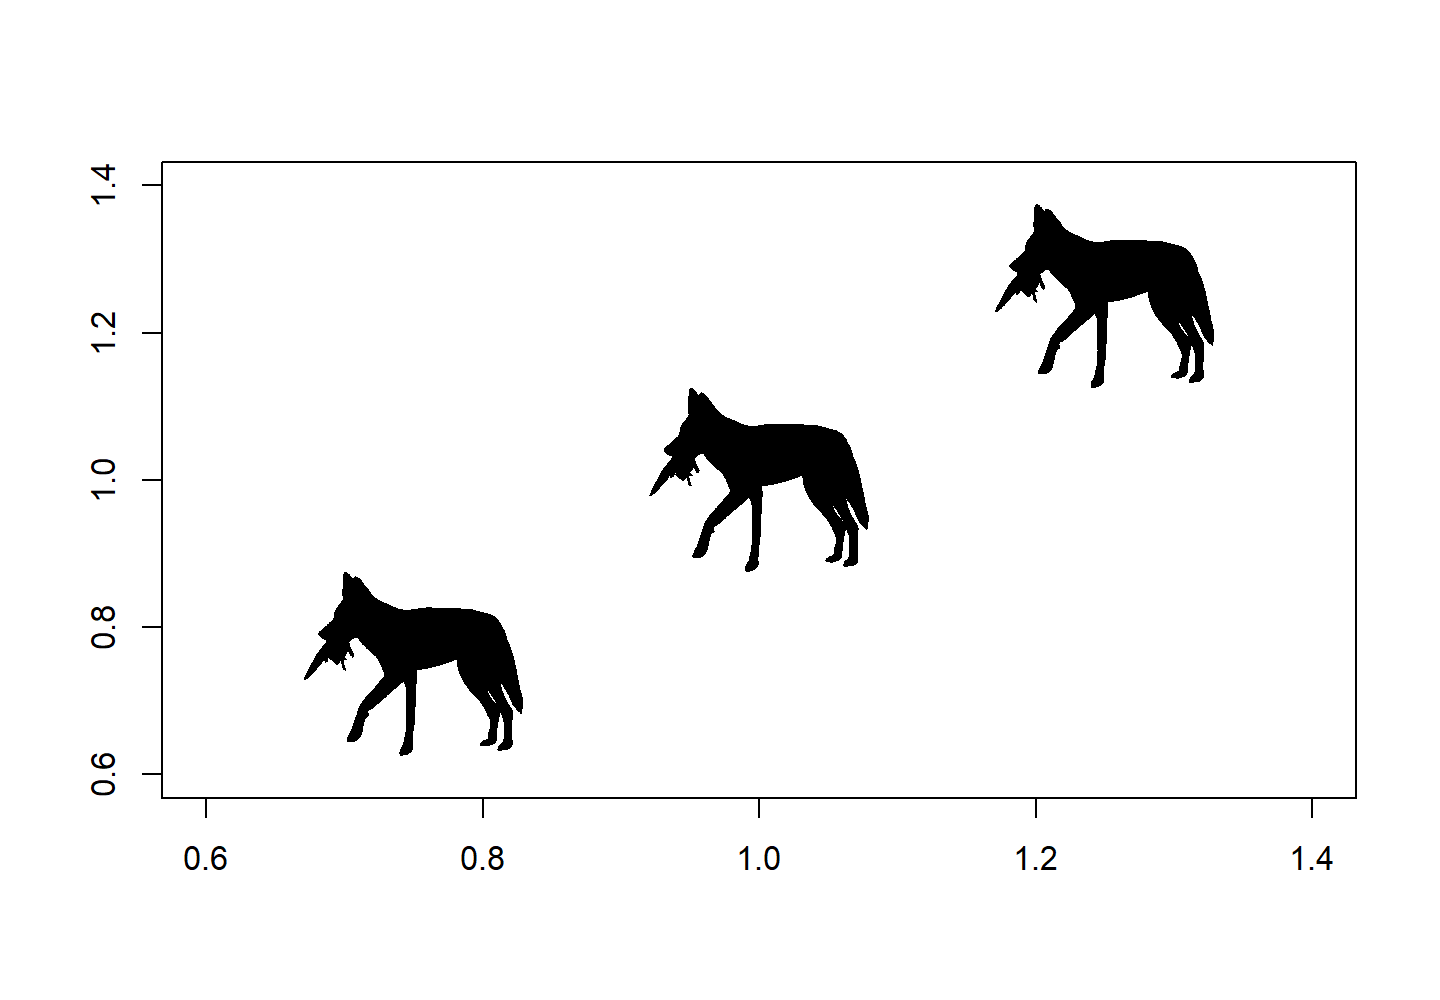
plot of chunk intro-base-plot
Ah, you’ve found out our little secret! You can actually skip the
steps of getting the UUID altogether by just searching for the desired
taxon in add_phylopic_base(). However, this will always
return the first matched silhouette meaning you might be missing out on
all the other options! It’s always worth checking out your options with
pick_phylopic() first.
ggplot2
You can also accomplish the same plot with the ggplot2
package. Here, we’ll use the add_phylopic() function, but
the functionality and all of the arguments are the same:
library(ggplot2)
p <- ggplot() +
  coord_cartesian(xlim = c(0.6, 1.4), ylim = c(0.6, 1.4)) +
  add_phylopic(img = img, x = 1.25, y = 1.25, height = 0.25)

# But can't we just add an image straight away using the UUID? Sure!
uuid <- get_uuid(name = "Canis lupus", n = 1)
p <- p + add_phylopic(uuid = uuid, x = 1, y = 1, height = 0.25)

# What about just using the first image linked to the name? Definitely!
p + add_phylopic(name = "Canis lupus", x = 0.75, y = 0.75, height = 0.25)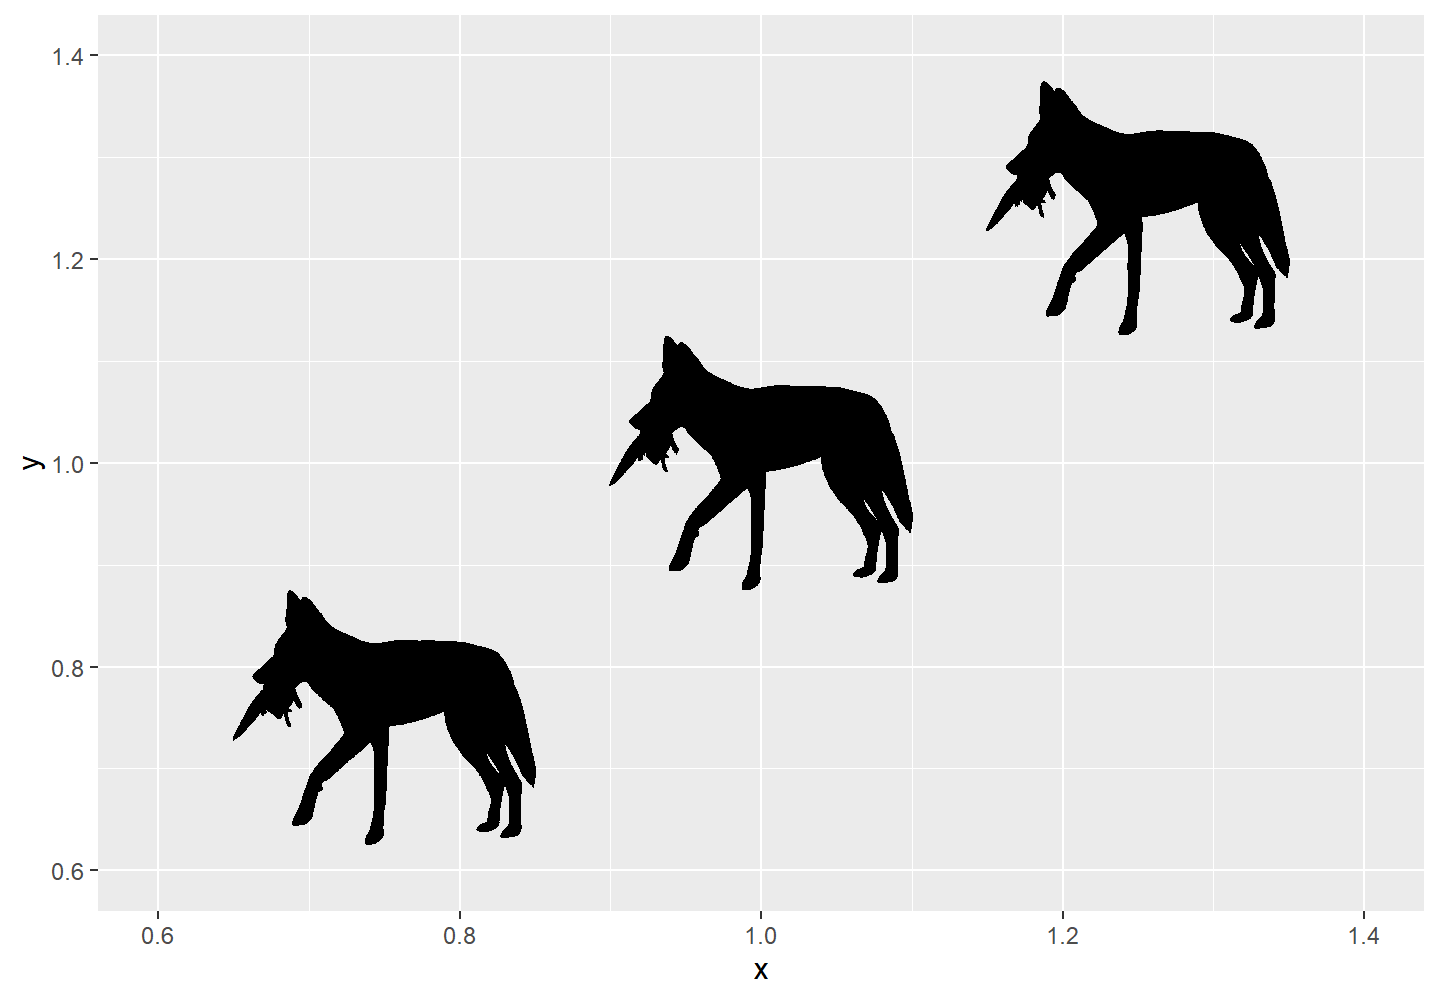
plot of chunk intro-ggplot-plot
Transforming silhouettes
Once a silhouette is picked and saved in the your R environment, it may be useful to transform the image to better suit the particular visualization of interest. We have implemented three user-friendly functions to accommodate three transformations that might be desired: flipping, rotating, and recoloring.
The flip_phylopic() function can be used to flip a
silhouette horizontally and/or vertically. This may be useful if, for
example, you want all of the silhouettes to face the same direction.
# Flip silhouette horizontally
img_flip <- flip_phylopic(img = img, horizontal = TRUE, vertical = FALSE)
The rotate_phylopic() function can be used to rotate a
silhouette an arbitrary number of degrees. This may be useful when
trying to align a silhouette with text or other objects within a
figure.
# Rotate silhouette by 45 degrees
img_rot <- rotate_phylopic(img = img, angle = 45)
Finally, the recolor_phylopic() function can be used to
modify the fill color, outline color, and/or transparency of a
silhouette. The vast majority of PhyloPic silhouettes are solid black,
are fully opaque, and have a transparent outline by default. However, it
may be useful to change this when the you are trying to either match an
existing visualization color palette or trying to convey extra
information, such as categorical data, through color.
# Change fill color to blue and transparency to 50%
img_col <- recolor_phylopic(img = img, alpha = 0.5, fill = "blue")
Let’s see what those look like in the same plot:
ggplot() +
  coord_cartesian(xlim = c(0.6, 1.4), ylim = c(0.6, 1.4)) +
  add_phylopic(img = img_flip, x = 1.25, y = 1.25, height = 0.25) +
  add_phylopic(img = img_rot, x = 1, y = 1, height = 0.25) +
  add_phylopic(img = img_col, x = 0.75, y = 0.75, height = 0.25,
               fill = "original")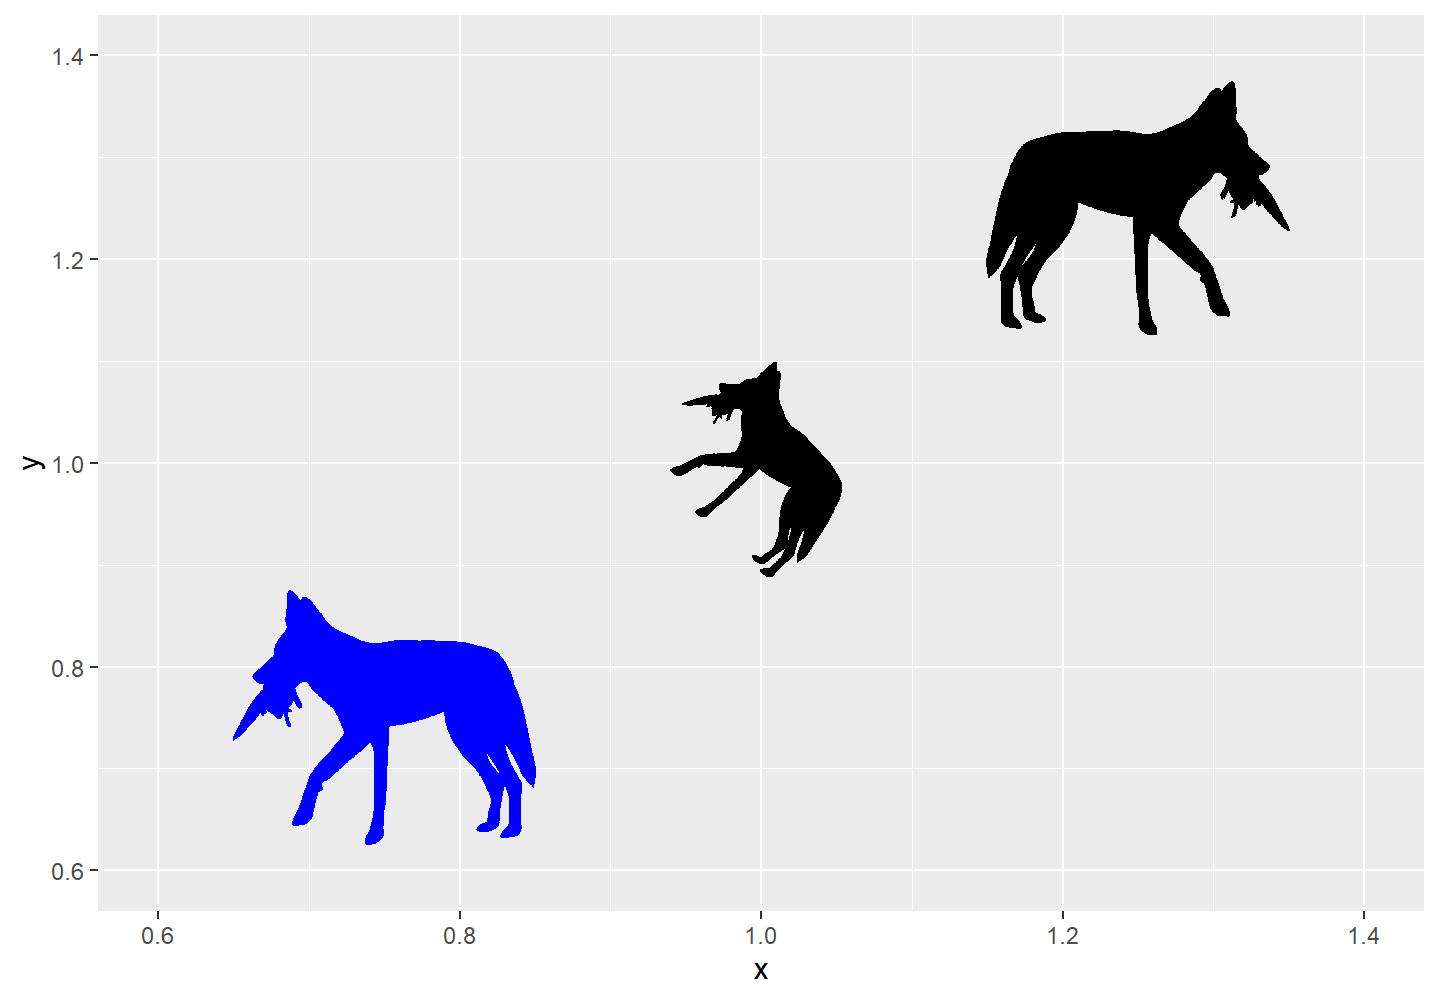
plot of chunk intro-transform-plot
You’ll notice that the rotated silhouette is smaller than the other
two silhouettes. This is because we’ve specifed the height
of our silhouettes. The width is then automatically set to maintain the
original aspect ratio of the silhouette. In this case, the aspect ratio
of the rotated silhouette has changed, so the same height
results in a smaller silhouette overall. If you’d prefer, you could also
specify the width of the silhouettes.
For convenience, we have also included these transformation options
within all of the visualization functions. The default fill is “black”,
hence why we needed to specify fill = "original" above.
However, when the same transformed silhouette will be used for multiple
visualizations, we suggest transforming the silhouette first, saving it
as a new object, then using this new object for visualization
purposes.
Get attribution
Now that you’ve made a plot and used some silhouettes, you should
acknowledge the contributors that made those silhouettes. Fortunately,
rphylopic includes the get_attribution()
function to get contributor data about specific images:
# Get valid uuid
uuid <- get_uuid(name = "Nycticebus")
# Get attribution data for uuid
get_attribution(uuid = uuid)
## $images
## $images$`7f877a9e-53d7-48d0-a422-d3fa0ff5e2f9`
## $images$`7f877a9e-53d7-48d0-a422-d3fa0ff5e2f9`$attribution
## [1] "Mareike C. Janiak"
##
## $images$`7f877a9e-53d7-48d0-a422-d3fa0ff5e2f9`$contributor
## [1] "Mareike Janiak"
##
## $images$`7f877a9e-53d7-48d0-a422-d3fa0ff5e2f9`$contributor_uuid
## [1] "7bed68fb-cf59-4e58-aed1-41e81269fb01"
##
## $images$`7f877a9e-53d7-48d0-a422-d3fa0ff5e2f9`$created
## [1] "2020-05-19"
##
## $images$`7f877a9e-53d7-48d0-a422-d3fa0ff5e2f9`$contact
## character(0)
##
## $images$`7f877a9e-53d7-48d0-a422-d3fa0ff5e2f9`$image_uuid
## [1] "7f877a9e-53d7-48d0-a422-d3fa0ff5e2f9"
##
## $images$`7f877a9e-53d7-48d0-a422-d3fa0ff5e2f9`$license
## [1] "https://creativecommons.org/publicdomain/mark/1.0/"
##
## $images$`7f877a9e-53d7-48d0-a422-d3fa0ff5e2f9`$license_abbr
## [1] "Public Domain Mark 1.0"This function can even write a little blurb for you to include in your publications:
# Get valid uuid
uuid <- get_uuid(name = "Nycticebus")
# Get attribution data for uuid
get_attribution(uuid = uuid, text = TRUE)
## Organism silhouettes are from PhyloPic (https://www.phylopic.org/; T. Michael Keesey, 2023) and were added using the rphylopic R package ver. 1.7.0 (Gearty & Jones, 2023). Silhouette was made by Mareike C. Janiak, 2020 (Public Domain Mark 1.0). Silhouette was contributed by Mareike Janiak.Save an image
You should be able to accomplish all of your visualization needs
within R (see our other vignettes for examples), but in the rare case
that need to use a silhouette outside of R, we’ve also got you covered
with the save_phylopic() function. You can save silhouettes
in a range of formats, including: Portable Document Format (PDF),
Portable Network Graphics (PNG), Scale Vector Graphics (SVG), Tag Image
File Format (TIFF), Joint Photographic Experts Group (JPEG), and bitmap
(BMP).
# How do I save an image?
# Get image
img <- pick_phylopic(name = "Phascolarctos cinereus", n = 1)
# Save image
save_phylopic(img = img)